Where the gap actually is
Part 4 of 4 (7 minute read)| By Aarez Osman, Research Fellow
Key takeaways
Before claiming anything new, we searched for everyone who might have gotten there first. Sheaf methods have been applied to sensors, social agents, enterprise data, risk analysis, and national accounting.
The closest work, from sensor fusion, already provides the instrument an organization would need: a consistency radius that bounds how much any reconciliation must distort the data, and a filtration that shows which sources agree at which tolerance.
The published work stops just short of organizational measurement: a company's own systems disagreeing about what happened. The mathematics is ready for it.
We close with what this could look like in practice: a weekly readout for a CMO, CRO, and COO showing where disagreement sits, who owns each definition, and which numbers have been tested against the world.
Suppose Acme, the hypothetical company followed through this series, asked its data team for a single report: every handoff between systems, how far apart the numbers are after documented definitions are applied, who owns each definition, and whether anyone has tested the agreement against the world.
Every part of that report has been built before, somewhere. None of it, as far as we can find, has been built for this.
How we searched
The question was narrow on purpose. Sheaf theory has clearly been applied to data. We wanted to know whether anyone has applied sheaf methods to an organization's own honest measurement systems contradicting each other about what happened.
We searched Google Scholar and arXiv for "sheaf" combined with organization, business, management, governance, and consensus, and traced the papers citing Hansen and Ghrist's discourse-sheaf work. We also checked two adjacent literatures. Topological data analysis has been applied to organizational networks, but the examples we found were academic co-authorship networks and political Twitter data. The business literature on KPIs and dashboards talks constantly about a "single source of truth," but none of it connects that phrase to sheaf mathematics. We followed each remaining lead until it either answered the question or turned away from it.
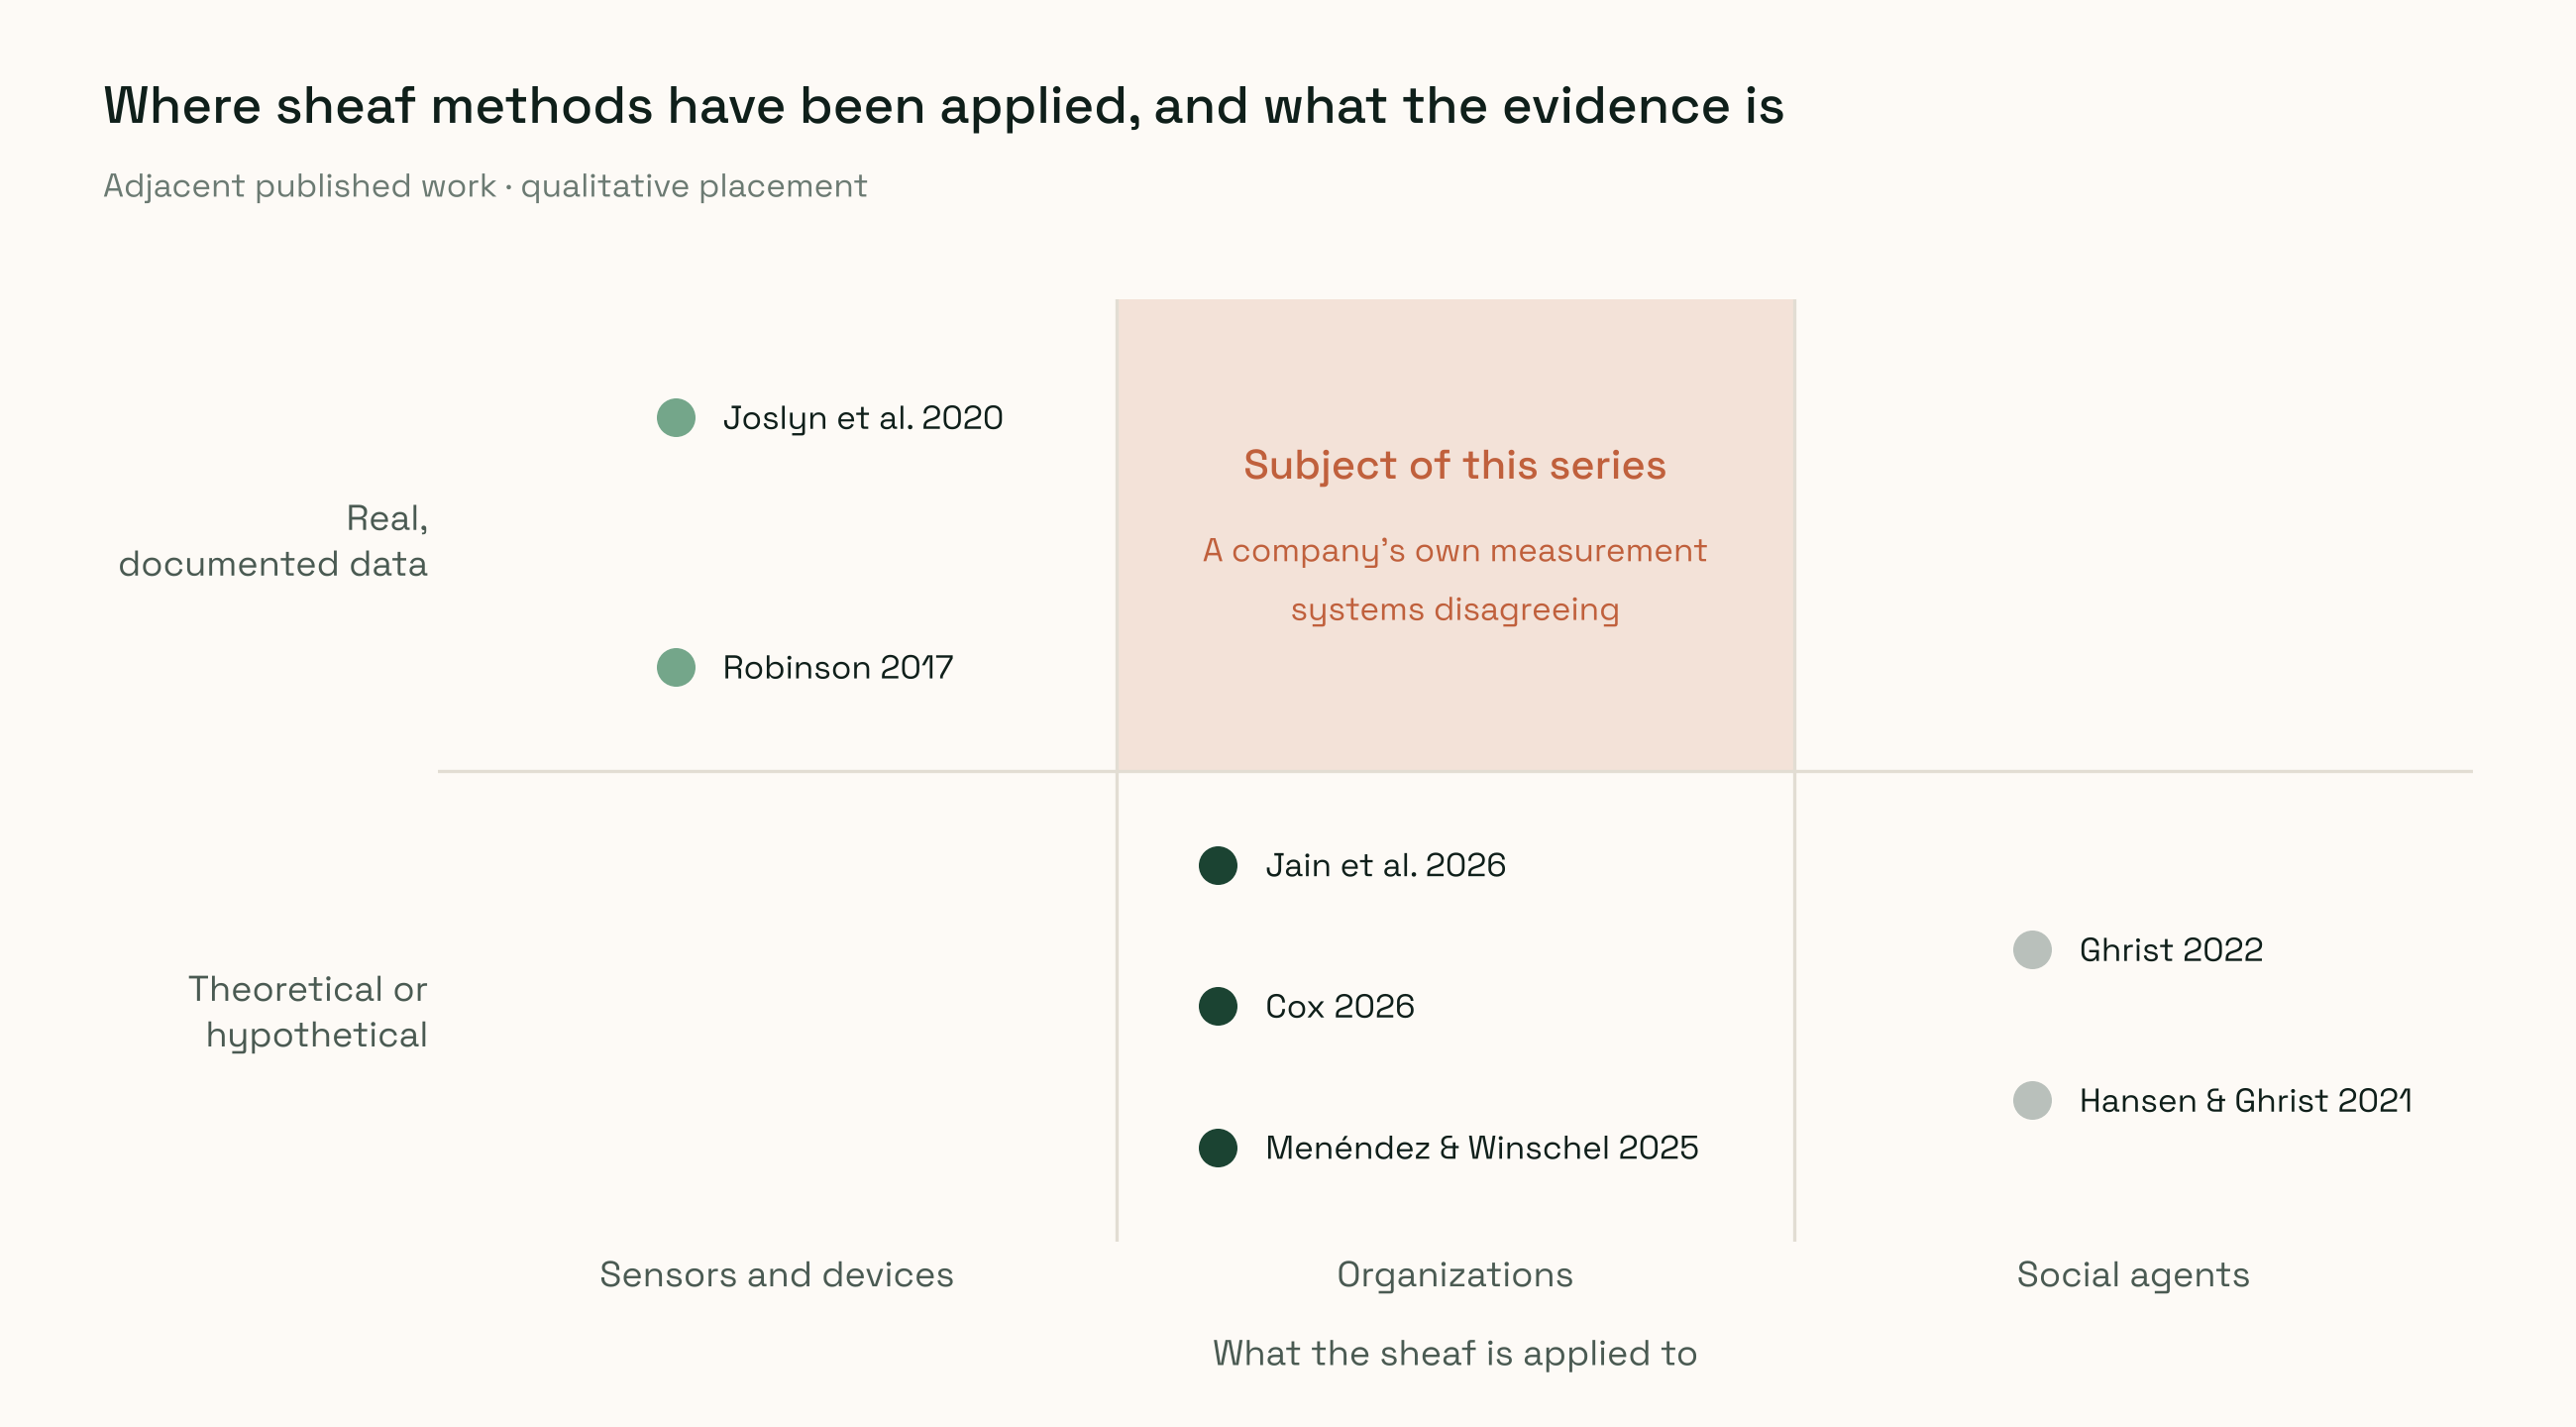
Figure 4. Adjacent work positioned by what the sheaf is applied to and where the evidence comes from. Placement is qualitative. The highlighted region is the subject of this series.
The closest work: sensors in the field
The most important adjacent work comes from sensor fusion. In 2017 Michael Robinson argued that sheaves are the canonical data structure for sensor integration (Robinson, Information Fusion). His framework separates three things organizations usually blur together: a model of how sources relate, which contains no data at all; a measure of how consistent a given set of readings is with that model; and a fusion step that produces one consistent picture.
The measure is the consistency radius. It is source-agnostic, and it places a lower bound on how much any fusion process has to distort the original data to make it agree (Robinson, arXiv). In one search-and-rescue demonstration, a consistency radius of 152 kilometers signaled that data and model were seriously in conflict (Robinson, IAS talk).
A paper by Cliff Joslyn and colleagues, including Robinson, published in Sensors in 2020, took this into the field. The team tracked black bears with GPS collars while researchers followed with a radio receiver, a vehicle GPS, and written location reports, then modeled all four sources as a sheaf (Joslyn et al., Sensors). They went beyond a single score to a consistency filtration: a ladder showing which combinations of sources agree at which tolerance. For one reading, the vehicle and receiver agreed within about 9.5 meters, while the receiver and the collar disagreed by a radius of 464.5, by far the largest gap in the system.
Structurally, this is almost exactly the instrument an organization needs. Replace the collar, receiver, and vehicle with the CRM, the attribution platform, and the ERP, and the filtration becomes a map of which systems agree, within what tolerance, and which seam carries the strain this week.
The same paper contains the most important caution in the literature. The consistency radius "does not and cannot tell you what the measurements are, nor does it tell you which measurements are more trustworthy" (Joslyn et al.). That is the formal version of the Uber lesson from Part 3.
Three near misses, three boundaries
Three more lines of work came close, each stopping at a different boundary.
Enterprise data. A 2026 chapter by Neeraj Jain and colleagues treats enterprise knowledge graphs as a local-to-global integration problem (Jain et al.). That is essentially record matching. Our question concerns valid measurement methods that produce different numbers.
Organizational judgment. Louis Anthony Cox Jr.'s 2026 paper in Risk Analysis, "Integrating Fragmented Risk Knowledge: Sheaf Theory for Risk Analysts," draws on Hansen and Ghrist and applies sheaf methods to whether risk knowledge held by different teams and experts can be integrated into a coherent strategy, including detecting irreconcilable policy conflicts (Cox, Risk Analysis). It is the closest in spirit. But its subject is beliefs and assessments, and its examples are hypothetical or drawn from public policy.
Accounting. Renée Menéndez and Viktor Winschel's 2025 "Monetary Macro Accounting Theory" proposes category theory and sheaf theory to guarantee invariances between firm, bank, and macroeconomic levels of accounting (Menéndez and Winschel, arXiv). By subject it is the closest of all. It is also entirely theoretical: a specification of how things should add up, with no data and no documented disagreement.
The opinion model itself keeps advancing; a 2026 paper studies agents that selectively adapt both beliefs and communication on cellular sheaves (Selective Adaptation of Beliefs and Communication on Cellular Sheaves). Its subject is still individual agents.
Where the literature stops
The pieces exist: a measure of disagreement, a structure describing what can agree, a fusion method with known distortion bounds, and a filtration that locates the strain. The published work applies them to sensors, social agents, expert beliefs, and accounting theory. Organizational measurement, the everyday case of a company's own systems disagreeing about what happened, sits just outside that body of work.
What it could look like on a Monday
Here is the report Acme asked for at the top of this post, as an illustrative weekly readout for its CMO, CRO, and COO.
Marketing automation to CRM (pipeline). Definition owner: CMO and CRO jointly. Residual after documented maps: $2.1M. Share of total strain: 69%. Tested by intervention: No.
CRM to ERP (bookings). Definition owner: CRO and COO. Residual after documented maps: $1.4M. Share of total strain: 31%. Tested by intervention: Not applicable.
Ad platforms to CRM (demo requests). Definition owner: CMO. Residual after documented maps: 600 requests over-claimed. Share of total strain: Reported separately. Tested by intervention: Branded search: yes, 6% incremental. Paid social: never tested.
Renewal expansion (new vs. retained). Definition owner: CRO, COO, CFO. Residual after documented maps: Structural conflict, $800K. Share of total strain: Cannot be reconciled under current rules. Tested by intervention: Not applicable.
Illustrative readout for Acme (hypothetical), combining the examples from Parts 1 through 3.
Read it as a set of decisions. The CMO and CRO share the handoff that carries most of the organization's disagreement. The COO's bookings gap is real, smaller, and concentrated in three accounts. Paid social is the largest claimed channel and has never been tested, which makes it the number the CMO should trust least, even though it looks most precise. The renewal conflict needs a definitional decision from three executives, and until it gets one, the board will keep seeing two incompatible versions of growth.
None of this replaces the forecast, the attribution model, or the ledger. It sits on the seams between them and says how much each should be believed when they meet. That connects directly to the working result at the center of Amoeba's research: making each system more precise does not, on its own, make an organization agree. If disagreement lives at the seams, the seams are where governance has to operate.
A note on the examples
This post maps published prior work. The readout above is a hypothetical illustration built from the Acme examples in Parts 1 through 3. None of the mathematics in this series is new. Its interest lies in what these established tools say about a familiar organizational problem.
Previous: Part 3, "Honest systems, different numbers" · Start of series: Part 1, "The truce in the numbers"
References
Robinson, M. Sheaves are the canonical data structure for sensor integration. Information Fusion, 36:208–224, 2017. sciencedirect.com (preprint: arxiv.org)
Robinson, M. Sheaf methods for data fusion (IAS talk, 2018). ias.edu
Joslyn, C., Charles, L., DePerno, C., et al. A Sheaf Theoretical Approach to Uncertainty Quantification of Heterogeneous Geolocation Information. Sensors, 2020. pmc.ncbi.nlm.nih.gov (preprint: arxiv.org)
Jain, N., Dutt, M., Deshmukh, S., and Londhe, G. V. Multimodal Enterprise Knowledge Graphs. In Natural Language Processing for Business and Organizations, CRC Press, 2026. taylorfrancis.com
Cox, L. A., Jr. Integrating Fragmented Risk Knowledge: Sheaf Theory for Risk Analysts. Risk Analysis, 46(3), 2026. onlinelibrary.wiley.com
Menéndez, R. and Winschel, V. Monetary Macro Accounting Theory. arXiv 2506.21651, 2025. arxiv.org
Selective Adaptation of Beliefs and Communication on Cellular Sheaves, 2026. arxiv.org
Hansen, J. and Ghrist, R. Opinion Dynamics on Discourse Sheaves. www2.math.upenn.edu

Unleash the Potential of Data Science
Amoeba is your trusted companion in turning complex data into clear, actionable insights, effortlessly connecting it to your marketing goals. Say goodbye to guesswork and make confident decisions that truly drive results