The math came first
Part 2 of 4 (7 minute read)| By Aarez Osman, Research Fellow
Key takeaways
The opinion model in Part 1 sits on top of a general mathematical theory, the spectral theory of cellular sheaves, that was written with no people in it. That is why it transfers to measurement systems.
The theory supplies four concrete tools: a measure of disagreement that can be located edge by edge, a structural test of whether agreement is possible at all, a reconciliation with a known and auditable destination, and a way to learn undocumented definitions from data.
Applied to Acme, a hypothetical company, the tools show that most of a $15 million pipeline gap is definitional, that 69 percent of the remaining strain sits on a single handoff, and that one disagreement cannot be fixed with data at all.
Most enterprise data investment models the nodes: the systems. Whether an organization can agree is decided by the edges, and those are rarely modeled.
After Part 1, Acme's leadership has a better story about why its numbers diverge. A story still leaves them without an instrument. The CRO wants to know how much of the $15 million pipeline gap is real. The COO wants to know whether the $1.4 million bookings gap is the bigger problem. The CMO wants to know whether any single number can satisfy everyone.
Those are quantitative questions, and the mathematics underneath the discourse sheaf answers each of them. To see why, it helps to read the work backward.
Reading backward through three papers
The most accessible layer is a short 2022 workshop paper by Robert Ghrist, "Harmonicity in Networked Social Information Dynamics" (ICWSM Workshop Proceedings). It is barely two pages, and it states the private-belief, public-expression framing most cleanly. It also argues that internal states need not be numbers at all. They can be lattices, ordered structures closer to a personal logic than a score, drawing on Ghrist's work with Hans Riess on the "Tarski Laplacian." For organizations, where many important states are labels such as a deal stage, a risk rating, or a lifecycle status, that matters.
Underneath it is "Opinion Dynamics on Discourse Sheaves" by Ghrist and his former doctoral student Jakob Hansen, posted in 2020 and published in 2021 (arXiv 2005.12798). This is where the discourse sheaf is defined, its Laplacian built, and the learning-to-lie dynamics worked out.
Underneath that is Hansen and Ghrist's "Toward a Spectral Theory of Cellular Sheaves," posted in 2018 and published in 2019 (arXiv 1808.01513). It contains no people and no opinions. Its aim is to extend spectral graph theory, the study of networks through the eigenvalues of a matrix called the Laplacian, to sheaves. It has since been cited hundreds of times (Google Scholar) and underpins later work on sheaf neural networks in machine learning (Neural Sheaf Diffusion).
The opinions came later. A general piece of mathematics turned out also to describe how people talk past each other. Nothing ties it to people, which means nothing stops us pointing it at a CRM and a ledger.
Four tools, applied to one company
Model Acme as a sheaf. The nodes are three systems: the marketing automation platform (owned by the CMO), the CRM (the CRO), and the ERP (the COO). The edges are the handoffs between them. The restriction maps are the definitions applied at each handoff: attribution windows, stage criteria, recognition rules. The data is what each system reports.
A measure of disagreement that has a location
Every sheaf has a Laplacian, and the Laplacian defines a quantity that is zero exactly when the data is perfectly consistent and grows as it departs from consistency. Ghrist describes it as the distance from the data to a global section (Ghrist, lecture on sheaf applications). Because the quantity is a sum over edges, it can be broken down: each handoff's contribution is visible.
At Acme, the first step is simply to write down the documented definitions and apply them. Most of the $15 million pipeline gap disappears, because it was the difference between a 180-day any-touch window and an inbound-only rule. What remains is a $2.1 million residual that no definition explains, mostly duplicate accounts and deals reopened under new IDs. The residual between the CRM and the ERP is $1.4 million.
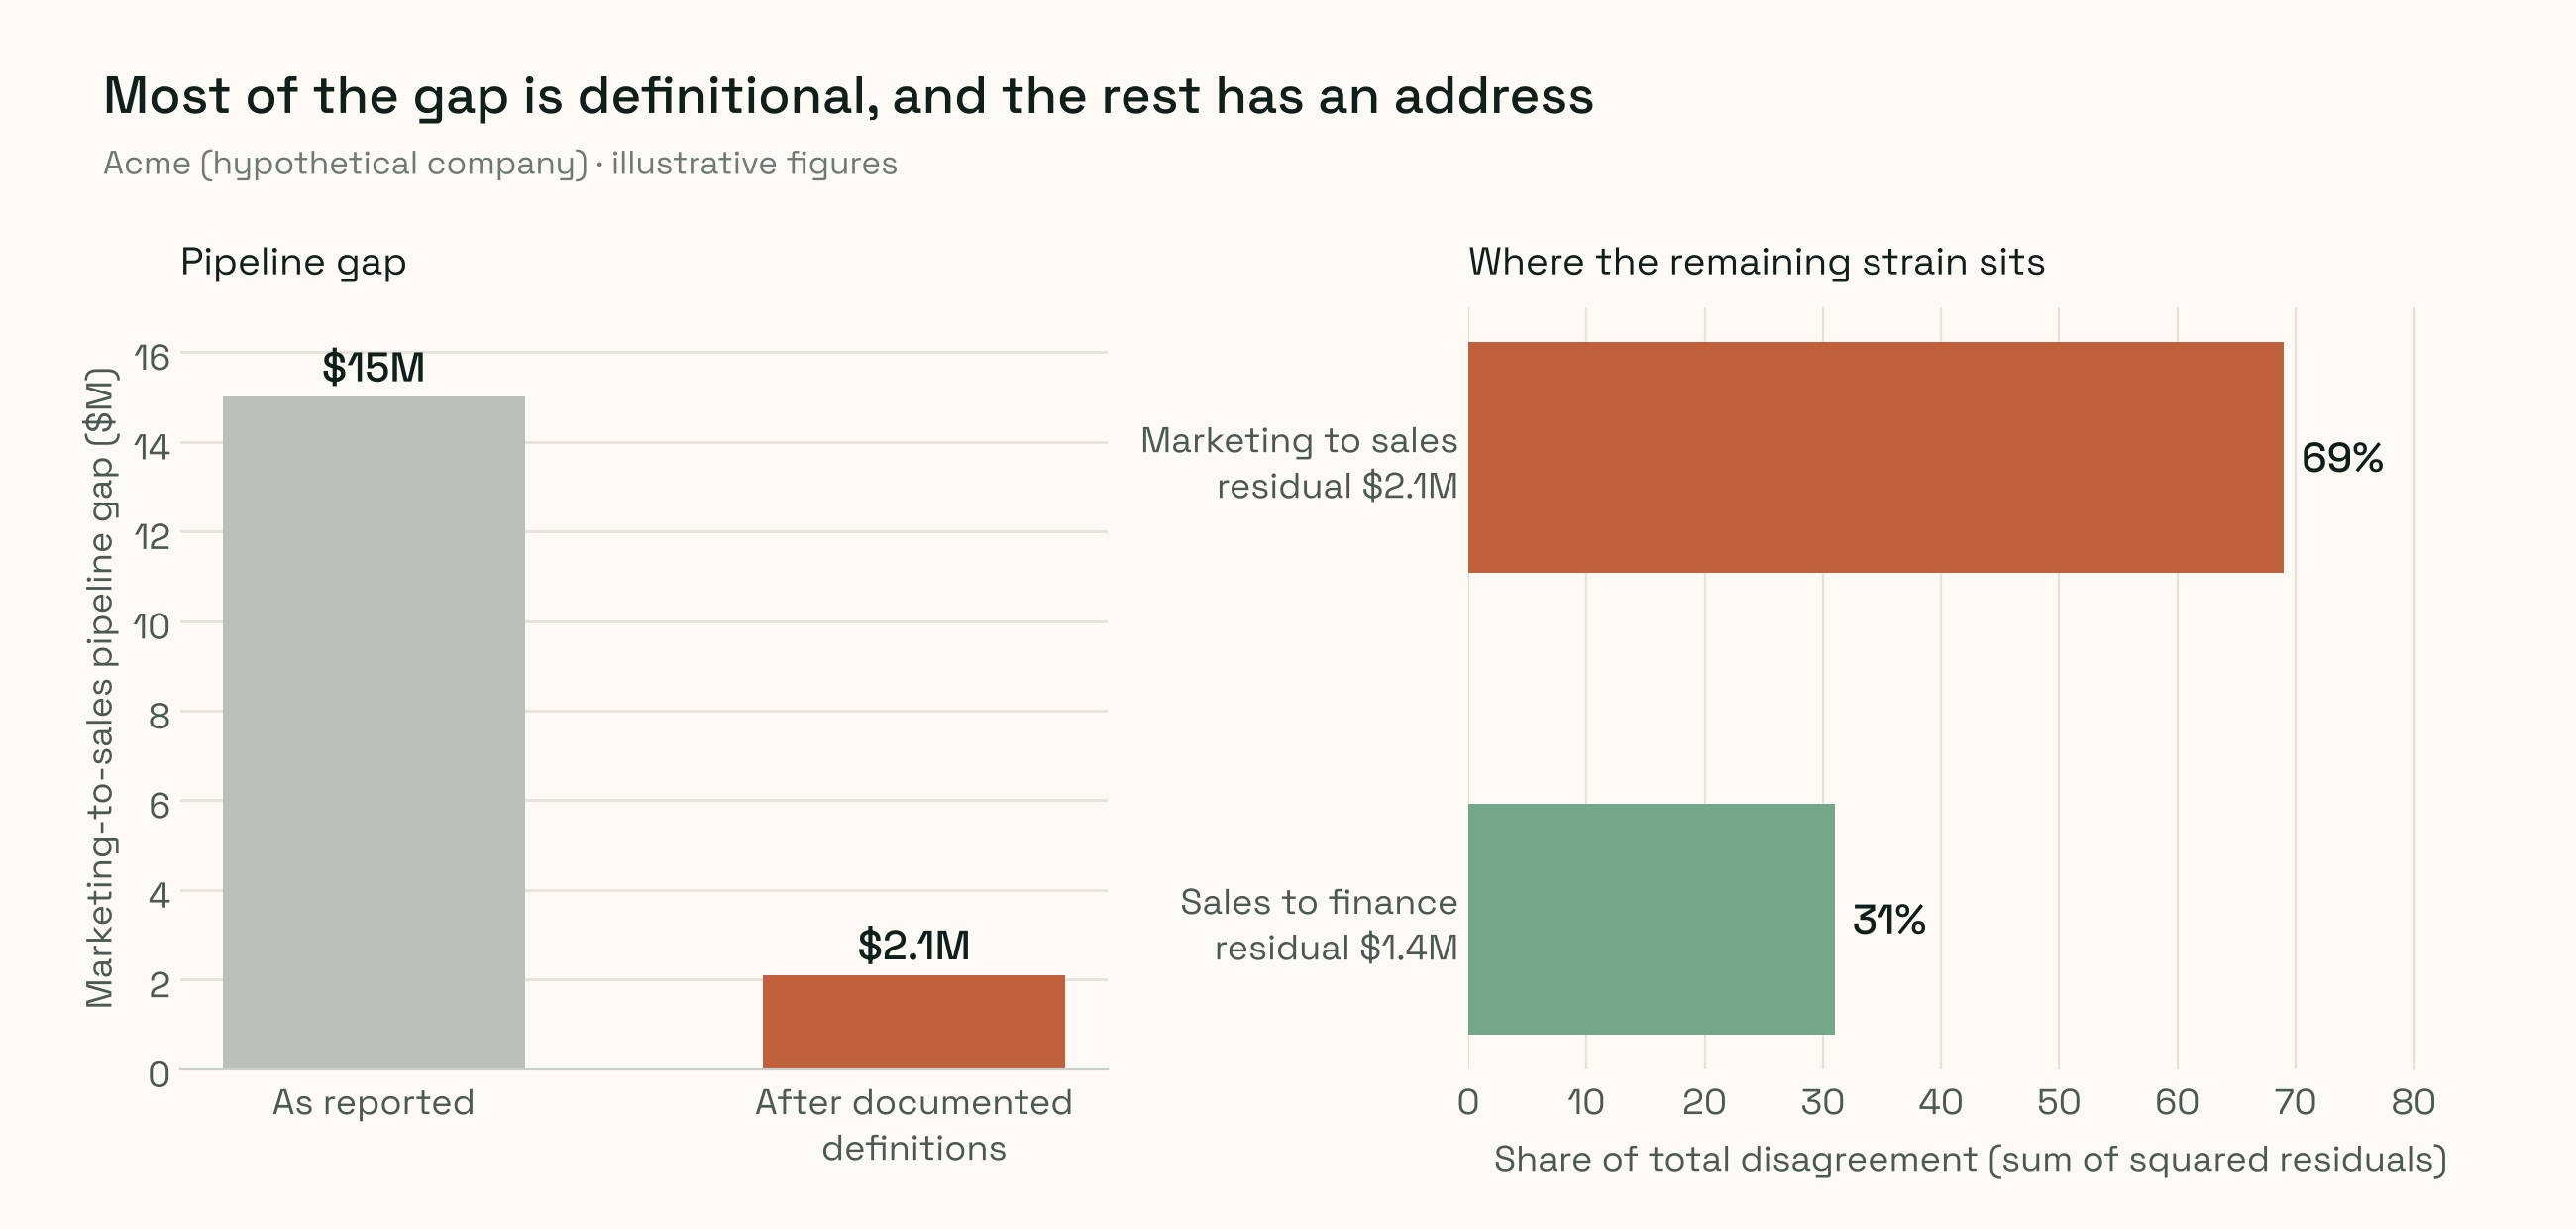
Figure 2. Acme (hypothetical). Left: applying documented definitions shrinks the pipeline gap from $15 million to a $2.1 million residual. Right: share of total disagreement by handoff, computed as each edge's squared residual over the total.
About 69 percent of Acme's total strain sits on the marketing-to-sales handoff and about 31 percent on sales-to-finance. The COO has been raising the smaller gap for two quarters. The larger one belongs jointly to the CMO and CRO, and it comes from record hygiene: duplicate accounts and reopened deals.
A structural test of whether agreement is possible
The kernel of the sheaf Laplacian computes the sheaf's cohomology: the space of configurations that are consistent everywhere (Hansen and Ghrist). This is a statement about structure, made before any data arrives. If definitions are built so that no assignment of numbers can satisfy them all, the impossibility is visible in the structure itself.
Acme has one. The CRO's compensation plan counts expansion signed at renewal as new bookings. The COO's net revenue retention metric counts the same expansion as retained revenue. The board pack requires that new bookings plus retained revenue equal the total change in annual recurring revenue. When an $800,000 upsell is signed alongside a renewal, no assignment of numbers satisfies all three rules. No amount of data cleaning will fix it. It is a design problem, and it belongs in a meeting between the CRO, the COO, and the CFO about definitions.
A reconciliation with a known destination
Running the sheaf version of the heat equation, letting each node move toward agreement with its neighbors, converges to the orthogonal projection of the starting data onto the consistent configurations (BIRS workshop notes). It is the closest consistent state to where you started, and the difference tells you exactly what had to change.
If Acme's board needs one pipeline figure, the projection might produce $29.4 million, along with the adjustment applied to each system. The CMO can see that her number moved down by $12.6 million and why. The CRO can see that his moved up by $2.4 million, mostly from misfiled deals. Compare that with the Part 1 outcome, where the board saw $27 million and no record of what was discarded. Both are single numbers. Only one is auditable.
A way to learn the definitions nobody wrote down
In a separate paper, Hansen and Ghrist pose the inverse problem: given data that is mostly consistent, infer the restriction maps that make it so, by minimizing total Laplacian energy (Hansen and Ghrist, Learning Sheaf Laplacians from Smooth Signals).
Acme has never documented how a marketing-qualified lead becomes a sales opportunity. Fitting that map to eighteen months of data might show that opportunities appear on average 23 days after qualification, and that inbound demo requests convert at roughly 0.6 while webinar leads convert at almost zero. The written definition treats the two the same. The fitted map shows the sales team treats them very differently. That is a finding the CMO needs before she sets next year's webinar budget, and it came straight from the data.
The lattice framing from Ghrist's workshop paper extends this to labels. Acme's sales team uses "Stage 3" to mean verbal commitment; the deal desk uses it to mean legal review has begun. Treated as ordered labels, the two stage ladders can be compared directly, and the comparison shows that a sales "Stage 3" is sometimes an operations "Stage 2."
The seams are not modeled
This changed how we think about data infrastructure. Almost every enterprise data investment models the nodes. Warehouses consolidate where data is stored. Semantic layers standardize what a field means inside a system. Dashboards present the result. All of it assumes that if each node is clean, the organization will agree.
The sheaf framing says that assumption is incomplete. Whether an organization can agree is determined by the edges and the maps on them, and in most companies those live in spreadsheets, tribal knowledge, and footnotes that disappear between quarters. A decision system that wants to explain why two honest numbers differ needs a first-class representation of the seam: the definition, its owner, its history, and how much disagreement it currently carries.
A note on the examples
The mathematical tools here are published and well established. Acme and its figures are hypothetical, chosen to illustrate what each tool reports. Two properties of the tools are worth keeping in mind. The measure of disagreement depends on how the restriction maps are specified, so the definitions themselves deserve care. And every tool here measures consistency between systems; none of them measures truth. Part 3 shows why that distinction matters in practice.
Previous: Part 1, "The truce in the numbers" · Next: Part 3, "Honest systems, different numbers"
References
Ghrist, R. Harmonicity in Networked Social Information Dynamics. ICWSM Workshop Proceedings, 2022. workshop-proceedings.icwsm.org
Hansen, J. and Ghrist, R. Toward a Spectral Theory of Cellular Sheaves. Journal of Applied and Computational Topology, 2019. arxiv.org
Hansen, J. and Ghrist, R. Opinion Dynamics on Discourse Sheaves. arXiv 2005.12798. alphaxiv.org
Hansen, J. and Ghrist, R. Learning Sheaf Laplacians from Smooth Signals. jakobhansen.org
Ghrist, R. Sheaves and Applications (lecture slides). math.ku.dk
Sheaves on Networks (BIRS workshop talk, 2023). birs.ca
Bodnar, C., et al. Neural Sheaf Diffusion. alphaxiv.org

Unleash the Potential of Data Science
Amoeba is your trusted companion in turning complex data into clear, actionable insights, effortlessly connecting it to your marketing goals. Say goodbye to guesswork and make confident decisions that truly drive results